Have you ever wondered why your headphones sound different when listening to the same song at different volume levels? It’s because of something called the Fletcher Munson Curve. The Fletcher Munson Curve is a significant part of our modern world.
Only when you understand how the curve works can you truly appreciate its significance in all our lives. Let’s take a look at what it is, why it was created, how it came about, and the implications for everyone who enjoys music or uses any speaker-based technology.
What Is The Fletcher Munson Curve?
The Fletcher Munson Curve refers to a graph that shows the frequency response of our hearing at different sound pressure levels. It represents how we hear sounds according to loudness and frequency – both of which are measured in units known as decibels (dB).
Put simply, the concept states that human ears perceive frequencies differently across different levels. Our ears hear certain frequencies as ‘louder’. At lower volume levels, for example, we tend to be more attuned to mid-range frequencies (particularly in the range of 1kHz) while the low and high frequencies are difficult to perceive. As the volume levels are turned up, our ears become sensitive to the lower and higher frequencies which sound consequently louder.
How To Read The Fletcher Munson Curve
As explained above, Fletcher Munson curves are a set of contours which explain how we hear across different frequency curves. Each equal loudness contour curve represents the same intensity of loudness.
In order to interpret and read the Fletcher Munson Curve, pick one-phon curve from the example image above. You can see that there are 7 phon curves ranging from threshold to 100 phon.
Then choose a frequency on the x-axis and follow the line up until it intersects your phon curve of choice. Follow that line back to a point in the y-axis. The value is the perceived sound pressure level (or SPL) for that phon.
For example, picking the 20 phon curve and the frequency of 1000 Hz results in a sound pressure level (SPL) of 20 dB. This means that for a loudness level of 20-phons, a human perceives a frequency of 1000 Hz as having an SPL of 20 dB.
How The Fletcher Munson Curve Came About
The first Fletcher Munson Curve was created in 1930 by two US researchers called Harvey Fletcher and Wilden Munson. At the time, most people assumed human hearing was linear – meaning if you doubled the volume or intensity of a sound, it would be perceived as being twice as loud by your brain.
But this didn’t turn out to be true when they tested individuals with an audiometer, which measures how much you can hear at different frequencies and volumes. They found that the human ear is non-linear – we perceive low notes as being much louder than higher frequencies at the same volume level.

What Does This Mean For You As An Audio Engineer?
The Fletcher Munson curve has significant implications on the industry and your work as a sound engineer. Since our human ears hear different frequencies differently, your mix’s spectrum will be much broader at lower volumes than higher volumes.
For example, listening to music quietly can hide mistakes like distortion or harsh frequencies, but once we increase the volume, those same problems may become apparent or, worse, distracting.
When mastering your track, it is advised that you adjust the final EQ using medium-low volume. Hence, you get more accurate results and avoid over-boosting specific frequencies because they might sound perfect at low volume but too ear-piercing loud when played at a high volume.
How Do Fletcher Munson Impact Sound Levels?
Since the Fletcher Munson Curve shows us how our ear’s sensitivity to specific frequencies changes depending on volume, this causes a problem when mixing. For example, in the whole frequency spectrum, there are areas where two instruments covering similar ranges can make it difficult for you to pick out differences between them even though they might play different notes. That is commonly known as ‘masking.’
For example, if we look at these two guitars playing precisely the same notes but in different octaves, we hear the lower guitar much more clearly than, the higher one because its signal falls within that important middle area of our hearing range.
All types of sounds happen when there are too many in one place and when working with bass frequencies since low frequencies are potent and can easily mask other sounds.

What Is the Solution to This Problem?
One solution to eliminating masking at loud levels would be to turn down one of your instruments, but that might not always work depending on the song you are working with. A more common practice is using EQ cutting or lessening specific frequencies.
By using careful EQ cuts, you can help bring out certain parts of your track while making sure they do not stand out too much compared to all other elements surrounding them. After everything sounds great, increase the volume back up again just enough to not sound distorted but still let the effect shine through.
How to Use Fletcher Munson Curve During Music Mixing?
So how does this help when it comes to mixing your next track? Understanding the Fletcher Munson curve can help you determine how various loud sounds should be within any given mix.
That is important because some aspects of a mix, such as the kick drum, need to peak at higher levels to be heard above all other sounds. The human ear will perceive a bass sound with a loudness level of 60 dB as being much louder than one peaking at only 40 dB, but your stereo’s dB meter will tell you otherwise.
Different instruments have different frequency ranges in music mixing, which become more pronounced as the volume increases. In most recordings, there are usually four main parts: vocals, bass, drums, and highs. When these four distinct elements overlap within a mix, it becomes challenging for our brains to decipher where one ends, and another begins – this is known as masking.
For this reason, certain elements mustn’t be competing for space at similar frequencies. That is where the Fletcher Munson curve comes into play – by understanding how your ears perceive sounds in different frequency ranges at varying volume levels. You can effectively create a more accurate mix.

The Strategy to Use
It would be best if you mixed your music at a high volume. When someone listens to a mix at a low volume and seems to enjoy it, they will raise the volume. But what happens when they increase the volume and the mixture becomes irritating to the ear? They will switch it off and not want to listen to it again.
On the other side, if a person listens to your mix at low volume and finds it enjoyable while increasing the volume. They will continue listening to it and buy more of your mixes. That is because human beings concentrate more on music when the volume is high.
Problems That Can Result from Fletcher Munson
The Fletcher Munson can cause trouble when you record or edit music at low volume unaware. The low volume in most cases makes the low and high notes sound inferior; hence a person may decide to boost it.
The problem becomes visible when someone decides to listen to the edited song at high volume. The low and high notes will sound loud, thus irritating the ear. Therefore, the customer won’t enjoy the music and won’t purchase your music again.
The music seller wants to ensure their sales are improving daily, thus as a music seller, you need to keep in mind this phenomenon while using the Fletcher Munson curve to not interfere with your quality.
Other Uses of Fletcher Munson Curve
Fletcher Munson Curve is a great study tool for mixing, but it can also help you with other creative projects. The curve shows the frequency levels of the entire spectrum. So if your track’s bass is too bass, you can decrease that particular octave on this chart and vice versa if that bass needs more kick.
Another useful application of this chart would be to find out which part of the song sounds best in specific frequencies, so when mastering your track, you know which EQs will help bring out certain parts while not causing any problems at other frequencies.
How Does the Fletcher Munson Curve Work?
The curve essentially takes into consideration how sound is perceived when it enters our ears at different volumes. Since we are constantly bombarded with several sounds every day, our brains quickly adjust to this constant noise by dampening specific frequencies that don’t affect us much and amplifying those that need more attention.
How Equal Loudness Contours Affect How You Mix?
Equal loudness contours refer to a phenomenon that explains the relationship between the perceived loudness of a sound to the frequency for the human ears. The scale is vital since the human ear is very sensitive to different frequencies of sound.
Why does a 60 dB Sine Wave Seem Louder at 10 kHz Than at 50 Hz?
The answer to this relies on your brain and ears.
When a sound wave gets into your ear canal, the eardrum transfers the vibration to the inner ear. The vibrations simultaneously excite the stereocilia, which causes an electrical signal that travels through the auditory nerve to your brain.
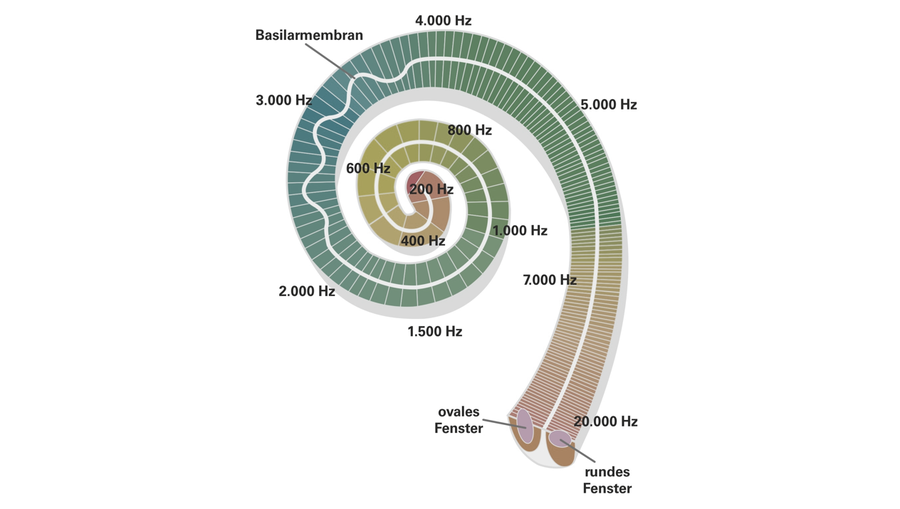
All this takes place in the cochlea organ, whose shape is like a coiled-up garden hose. The distribution of the hair cells in the cochlea is different. They are packed very close at the center, where the tube is coiled up tightly. Here is where you get the highest frequencies.
The distribution of the hair cells in the cochlea resembles the algorithm scale used to measure sound pressure level (SPS). That implies that some part of the perceived loudness is physiological. Fletcher Munson came about by analyzing people’s subjective experiences. That was used to come up with the differences in loudness through a spectrum.

Impacts of Fletcher Munson Curve on Mixing
This phenomenon also affects music mixing in that it will make specific instruments sound louder when in fact, they are not. That is important when working with compression – because the ear hears compressed signals as being louder, you can squeeze a track’s elements to become more in line with each other.
You need to know how your ears hear various sounds at different volumes to mix them without causing any masking or listener fatigue. A vital issue to remember here is that if you listen back to your mixes at low levels, you might be tricking yourself into thinking your mix sounds excellent simply because it “sounds loud.”
If someone later turns up the volume of your track, chances are they will be met with some unpleasant surprises. So if you listen to your final mix at low volume to “protect your ears,” it might not translate well when played back loudly.
Significance of Fletcher Munson Curve in Mixing Music
The Fletcher Munson curve shows that our ears are more sensitive to low frequencies at lower SPLs and higher SPLs. It also shows us how our hearing response changes with different volume levels, which helps explain the Loudness War.
Popular songs are mastered too loud by producers who want their music to sound as ‘impactful’ or ‘powerful’ as possible. Mixing music to the Fletcher Munson Curve will help your music sound more natural, making it easier for people to listen to your tracks on their TVs or iPods without having to constantly adjust the volume up or down whenever a new song starts playing.
Tips on How to Use Fletcher Munson Curve Effectively
1. Volume Compensation
Different sounds have different volumes. One person’s voice is another person’s whisper. It is necessary to adjust the volume rather than equalizer or other effects when controlling the dynamics and balance of the sound. It is better to reduce high and mid-range sounds by -3dB and low ranges by -6dB for a softer impact than adding +3dB on bass for loudness. You can add such changes gradually during production or even finalize with several versions.
2. Equalizing Your Song
By equalizing your song correctly, you make the difference between success and failure. You need to consider three crucial factors when balancing a song:
- Directional Focus of Sound
Many sounds in your mix may come from different directions, so you need to find the dominant direction. It could be lead vocal or instruments with high frequencies like acoustic guitars and harps, etc.
Use the EQ button on these sounds instead of putting other frequency ranges out of focus. For example, if the dominant sound is vocal, low frequencies (below 100Hz) should be cut down for less muddiness, while higher frequencies can stay because they do not fight for attention in lower range areas.
- Low-Frequency Range Masking
Low-frequency masking is another crucial factor in mixing. Several elements interfere with each other in the low-frequency range. The lower the frequency is, the more masking it has on different sounds because these two overlapping frequencies tend to cancel out. To avoid this problem, you can use the EQ button to reduce one of them until they fit together without conflicting with each other.
- Frequency Range Balance
All frequency ranges must play their roles in a song instead of just taking up space or fighting for attention over others. For example, vocals and guitars belong to the high-frequency range while bass guitar and kick drum belong to the low range. Cut off unnecessary frequencies, so only desired sounds remain.
3. Side Chain Compression (Equalizing)
Sidechain compression is used to create a unique pumping effect like in EDM. Boost the high frequencies (above 4kHz) to make the sound pump, while low frequencies (below 80Hz) should be reduced with the EQ button. For instance, you can cut down these two parts if you want a big snare to hit hard while the bass drum and bass guitar play low frequency.
4. Clean Sound Vs. Wet Signal
Mixing is not just about making it louder and combining different instruments; instead, it is about creating an immersive atmosphere for listeners, so they get sucked into your music easily. There are several ways to do this: little reverb or delay effects on vocal and main instruments such as lead electric guitar and lead vocals, panning sounds to different directions, or playing with volume to create various sound levels.
5. Do Not Rush It
Mixing is the most time-consuming task of all music production processes, so do not rush it. Take your time to work on each mixing stage, and you will eventually get a clean, sharp mix without too many effects. This way, you can make full use of available resources to maintain high quality instead of putting together something haphazardly within a limited time.
People Also Wonder
1. What Is Equal Loudness Contour?
The concept of equal loudness contours is often synonymous with the Fletcher Munson curve. The contours describe the perceived loudness of a sound in relation its frequency for humans.
The Fletcher Munson curve was first named when lead researchers Harvey Fletcher and Wilden A. Munson published their seminal paper about loudness and its definition in the Journal of the Acoustic Society of America.
2. What Frequency Is The Human Ear Most Sensitive To?
Using the principles of the Fletcher Munson curve, the curves are lowest in the range of 1 to 5 kHz with a prominent dip observed at 3 – 4Hz. This indicates the ears are most sensitive to this frequency range as frequencies below or above this range need their intensity level to be raised substantially to achieve the same impression of loudness.
Conclusion
Understanding the Fletcher Munson Curve will help you make better decisions when it comes to sound. This may extend to mixing your own tracks or even as an audiophile simply enjoying a diverse and eclectic range of music. The Fletcher Munson Curve is also a complimentary principle of psychoacoustics which can help when equalizing music and determining which settings best pair with your headphones or speakers.
We hope you find this article useful and be sure to share your views.
You may also be interested in:
- Best EQ Settings For Perfect Sound
- Harman Curve Explained
- Audio Frequency Spectrum Explained
- Psychoacoustics – The Science Of How We Hear
