
The Harman curve is one of the gold standards in industry frequency responses for headphones. This allows a buyer appreciate a device’s frequency response settings and decide which option best suits their desired listening experience. Here is everything you need to know about the Harman target curve.
Do Speaker Make Better Headphones and Vice Versa?
One of the most contradictory statements revolving around the study of the Harman target curve is that headphones are better at functioning speakers than speakers, and speakers make better headphones than headphones. The truth behind this statement is still arguable as researchers have dedicated over half a century’s work to prove the two parallel strands.
Everybody can agree that the two strands make notable improvements in spatial and tonal reproduction of sound. It is almost impossible for both findings to be simultaneously correct, and that is what we aim to discover in our research and conclusions in this article.
The Effects of Equalizing to a Calibration Curve
There are several factors involved regarding how strong sound is processed. Some of the most common factors include the recording and mastering techniques used like microphone panning and placement. The types of headphones used also play a vital role and are relative to the listener’s anatomy.
Remember that the effect of HRTF synthesis and correction is very minimal in wavelengths with high frequencies.
From the factors mentioned, it is true to say that there is a significant variation in sensitivity when it comes to headphone placement in every wear.
This variation might even occur during the same listening sessions if the headphone position subtly shifts its sitting position, and you can feel and hear it. The problem is dynamic and complex, and no improvements have proven convenient to yield excellent results.
Specialists can only achieve the desired results when they increase the transparency of sound engineers and their choices for recording. Painstaking listener experimentation can only prove practical in determining the ideal setting and positioning to eliminate the concern of diminishing returns and poor audio quality.
The more knowledge shared on this topic to the consumer increases pressure on manufacturers to address it and scale the possible solutions to improve the listening experience.
What Is The Harman Curve?
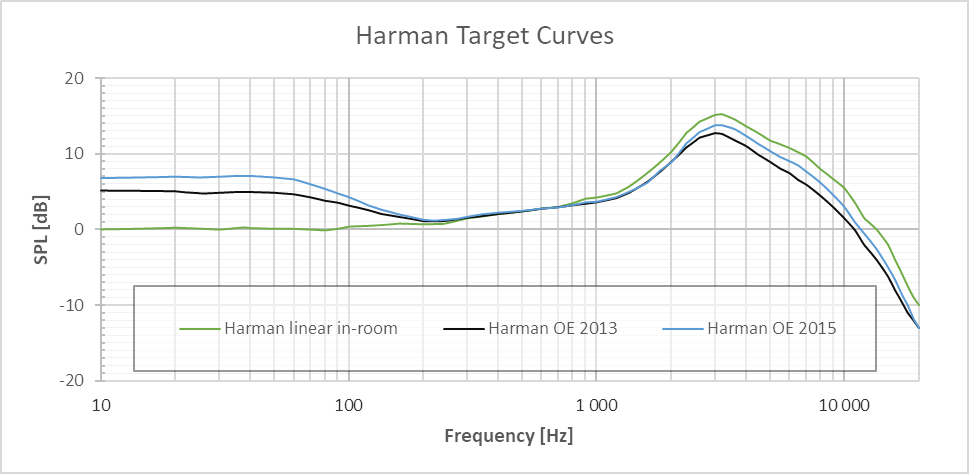
The Harman target curve is a rough approximation of what is acceptable in tonality to disregard individualization for precise tonality and spatial audio. The chart shows the target frequency response of an ideal pair of headphones, which levels they should exhibit, and the correct specialized equipment to measure it.
The History of The Harman Curve
Harman curve relates the link between perceptions and measurement of headphones’ sound quality. It resulted from a study done by Todd Welti and Sean Olive of Harman International, which culminated into a paper titled “The Relationship between Perceptions and Measurement of Headphone Sound Quality”.
The findings were presented at San Francisco in the 2012 Audio Engineering Society Convention. The whole study aimed at developing controlled listening test methods that sound engineers could use to predict accurate and reliable measures of headphones’ sound preferred by most listeners and their underlying sound attributes like bass, midrange, and treble.
As Sean Olive noted during the presentation, few published studies on controlled headphone sound measurement existed before. Also brands lacked consensus on an industry standard, as is the case with loudspeakers.
Harman curve, therefore, targeted to establish standard controlled, double-blind comparative and subjective evaluations that minimized headphone tactile and visual biases such as price, cosmetics, and brand.
The result was a standard measure of the diffuse-field and free-field headphones’ sound response that enabled sound engineers to design listener-targeted headphones.
Usually, designers make headphones samples, test them on a targeted group of listeners, then tweak the design and retest until most listeners are pleased. But with Harman curve, designers could tailor-make headphones targeted at a specific group of listeners with similar sound preferences rather than the usual “shooting in the dark” process.
More importantly, the testing phase of headphone designs was shortened significantly, saving costs in the development stages. Also, listeners can now compare different headphones’ sound quality using the Harman curve analysis tool before deciding what to buy.
Under the Harman curve, listeners are categorized into three potential groups:
- Harman curve lovers: This group comprises people under 50 primarily and forms 64% of all listeners. They prefer headphones with sound quality tuned very close to the Harman curve.
- More bass lovers: This group makes up 15% of all listeners and mainly constitutes male and young people. They prefer headphones tuned 3 to 6dB more bass than Harman curve at sounds below 300Hz, and 1dB more for outputs above 1 kHz.
- Less bass is better: Females and mostly older than 50 form the most significant chunk of this group, constituting 21% of all listeners. They prefer bass below the Harman curve by 2 to 3dB and 1db more on outputs above 1 kHz.
Since the landmark presentation in 2012, many brands have made products along the lines of the Harman curve. Earphones include JBL Live 200s, 500s, and 650s, Samsung Galaxy Buds, JBL Reflect Flows, while headphones include AKG N700 NCs, K361s, and K371s.
Even so, more research has been ongoing, and there are 19 papers already published and one patented in the study on headphones sound quality measurements and perceptions.
And as many listeners have attested, many headphones designed along the Harman curve guidelines sound better, though some have been deviated slightly to fit their target group perfectly.
For instance, the JBL adds an extra 2dB bass for outputs below 125Hz. But all in all, the Harman curve is proving to be an excellent baseline performance measure for headphones’ sound quality.
The Concept
The concept of the Harman curve came to life as Sean Olive and his team noticed no consistency in the sound quality of different headphone brands when evaluating in and over-ear headphones.
The few distinct trends present in listeners’ preferences led them to invest further into their research. They found it best to investigate and define the ideal target response for headphones to guarantee satisfaction to a more significant percentage of music consumers.
A measurement tool was also necessary to help accurately depict how their headphones compared to the Harmans curve.
It is essential to understand that this curve is ever-changing. Harman generated its first curve in 2013, significantly involving devices with low frequencies and featuring the DF response shelved below 200Hz. Two other curves exist, one released in 2015 and the other in 2017, featuring modified details but a similar target response.
How Is The Harman Curve Relevant?
The Harman curve is one of the greatest innovations for dedicated audiophiles across the world. It gives you the freedom to test out multiple audio devices and lets you pick the best prospect before making a purchase.
The Harman curve is a rough gauge predicting how much you will like your new headphone and if its features will create the ideal listening experience. The following facts will also be relevant to your gauging method:
- Your taste
- Your age and listening experience. Older listeners might fancy more treble and less bass to accommodate for hearing loss, while younger prospects prefer more of the bass and less of the treble
- The balance and spectrum of the music recording
- The headphones’ ability to mask bass and mid frequencies
Outlining Sound Localization in Human Beings
Understanding the relationship between human sound localization and frequency response is the first step to a better comprehension of the Harman curve. In-depth research on this matter will reveal four cues that dominate the directional localization, and here they are:
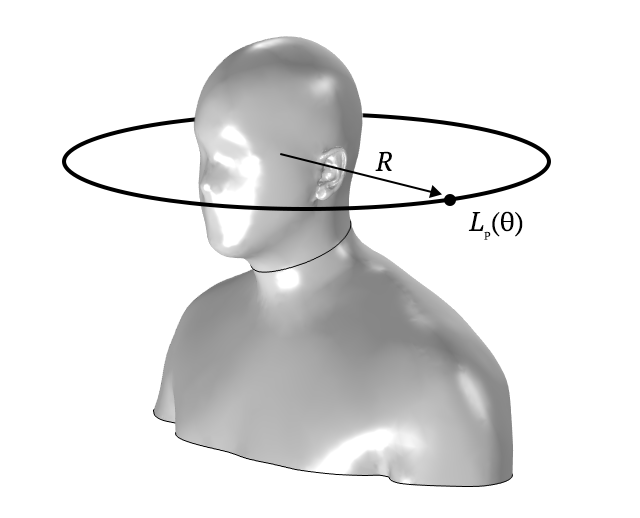
Head-related transfer function
The response of human ears to a sound source and locating the point of sound is what specialists refer to as the head-related function. Like the brain, inner and external ear, multiple parts of your body work together in locating the sound source.
Interaural time difference (ITD)
The interaural time difference is the difference in sound arriving in your right and left ear. The path between both your ears accounts for this time difference and proves helpful when identifying the location of a sound source.
Interaural phase difference (IPD)
The interaural phase difference is another crucial aspect in a human body used in sound localization. It refers to the phase difference in sound waves when reaching each of your ears, and it is significantly dependent on ITD and the sound wave frequency.
Interaural level difference (ILD)
The difference in loudness and frequency distribution between your two ears is the correct definition of interaural level difference. The strength of sound dissipates as it travels further, meaning that the sound will be loud to the ear closest to the source.
The HRTF is Relative to Every Ear
Each of your ears, left and right has a unique head-related transfer function because of multiple factors. Our shoulders, torso, ears, and head significantly contribute to the changes felt regarding the frequency response of external sound sources.
They create a cumulative effect since the sound from an external source will bounce off them before getting to your eardrums for interpretation.
HRTF Changes with Direction
The HRTF is not constant to direction; it changes as direction changes. Our brains map these directional changes once the altered sounds arrive in our eardrums, and we adapt to them. The cues between your two ears also have an essential role in HRTF cues.
Your head is responsible for The difference in time regarding sound reaching each of your ears and is between them and the different distances each of them stands from the sound source.
Another aspect contributing to this effect is how various sound sources have unique techniques for wrapping around your head and are greatly dependent on the frequencies involved. In the long run, we get to feel the inevitable difference in volume levels.
Above 1kHz, ILD Is More Predominant Than ITD
1kHz is the trade point where specific cues become predominant over others. In the case of ITD cues, placement at high frequencies lowers their consistency and preciseness. The corresponding wavelength is to blame for this effect as it measures around 18cm at 1kHz, the approximate diameter of the standard human head.
Frequencies become less able to wrap themselves around your head as the frequency gets higher and the wavelength shortens. ITD at 1kHz is less predominant because of its relative instability, while ILD gets more predominant at the same range. Loudness, phase, and timing are vital aspects our brains use to triangulate sound in a room.
You Can Predict Coarse Trends Using Broad HRTF Features
One crucial concept related to the Harman curves is determining coarse trends using the broad HRTF features available. The only challenge that may affect the productivity of this procedure is the variance in head morphology unique to each individual.
The ear canal and prima are parts of your body that amplify specific frequencies more than others. An ideal ear canal will attain resonance of around 3kHz in most sounds, with the shape and intensity of the resonance differing.
Tonality and space are not synonymous but are related in more ways than one. Individualization of the frequency response is necessary for accurate spatial reproduction and induces as the sound hits your eardrums, you feel the changes caused by the RTF.
How Sennheiser Achieves its Renowned Soundstage
The design of a headphone has a tremendous effect on its efficiency in handling the issue in question. Sennheiser HD800(S) is one such transducer that takes advantage of a modern design to tackle how it delivers sound to listeners.
Its angled drivers contribute the greatest to the company’s acclaimed soundstage as they create an HRTF closely resembling frontal HRTF in the generation to the ears during playback.
Conclusion
The Harman target curve is one standard everybody should consider taking seriously. This project goes to great lengths to ensure every listener enjoys the ideal headphone setting to improve their listening experiences. Reach out to us for more details on this topic, and we would also love to hear your thoughts on other key sound aspects.
You may also be interested in:
Good theres actual science behind this.. double blind testing is important